XPCS Viewer Documentation
XPCS Viewer is a Python toolkit for X-ray Photon Correlation Spectroscopy (XPCS) data analysis. It provides a PySide6 GUI and Python API for loading, visualizing, and fitting XPCS correlation functions from HDF5 data files.
At a Glance
Analysis |
G2 correlation (g2, g2 Fit, g2 Map), SAXS 1D/2D, two-time correlation, stability, diffusion |
Fitting |
NLSQ 0.6.0 point estimates + NumPyro NUTS Bayesian inference with ArviZ diagnostics |
Backends |
NumPy (default) and JAX (GPU acceleration, JIT, gradients) |
Mask Editor |
Interactive mask creation, Q-map generation, and Q-phi partitioning |
Data Format |
HDF5 (NeXus convention) with schema-validated I/O |
GUI |
PySide6 with light/dark themes, SVG icons, category tab bar, command palette, session persistence |
Key Features
- Correlation Analysis
G2 autocorrelation across dedicated tabs (g2 view, g2 Fit, g2 Map), two-time methods, SAXS 1D/2D visualization, sample stability monitoring, and diffusion coefficient extraction
- Fitting Pipeline
NLSQ warm-start followed by NumPyro NUTS sampling. Model selection via AIC/BIC, prediction intervals, and ArviZ convergence diagnostics (R-hat, ESS, BFMI)
- Backend Abstraction
Unified NumPy/JAX API with automatic fallback. JIT compilation and GPU acceleration for compute-intensive operations.
ensure_numpy()at I/O boundaries- Interactive Mask Editor
Drawing tools (Rectangle, Circle, Polygon, Line, Ellipse, Eraser) with undo/redo history, Q-map computation from detector geometry, and Q-phi partition export
Quick Start
# Install
pip install xpcsviewer-gui

# Launch GUI
xpcsviewer-gui /path/to/hdf/data

# CLI batch processing
xpcsviewer twotime --input /data --output /results --q 0.05
from xpcsviewer import XpcsFile

# Load XPCS data
with XpcsFile("data.hdf") as xf:
    q, t_el, g2, g2_err, labels = xf.get_g2_data()
    print(f"Q bins: {len(q)}, Delay points: {len(t_el)}")
Gallery
Analysis Modules Showcase
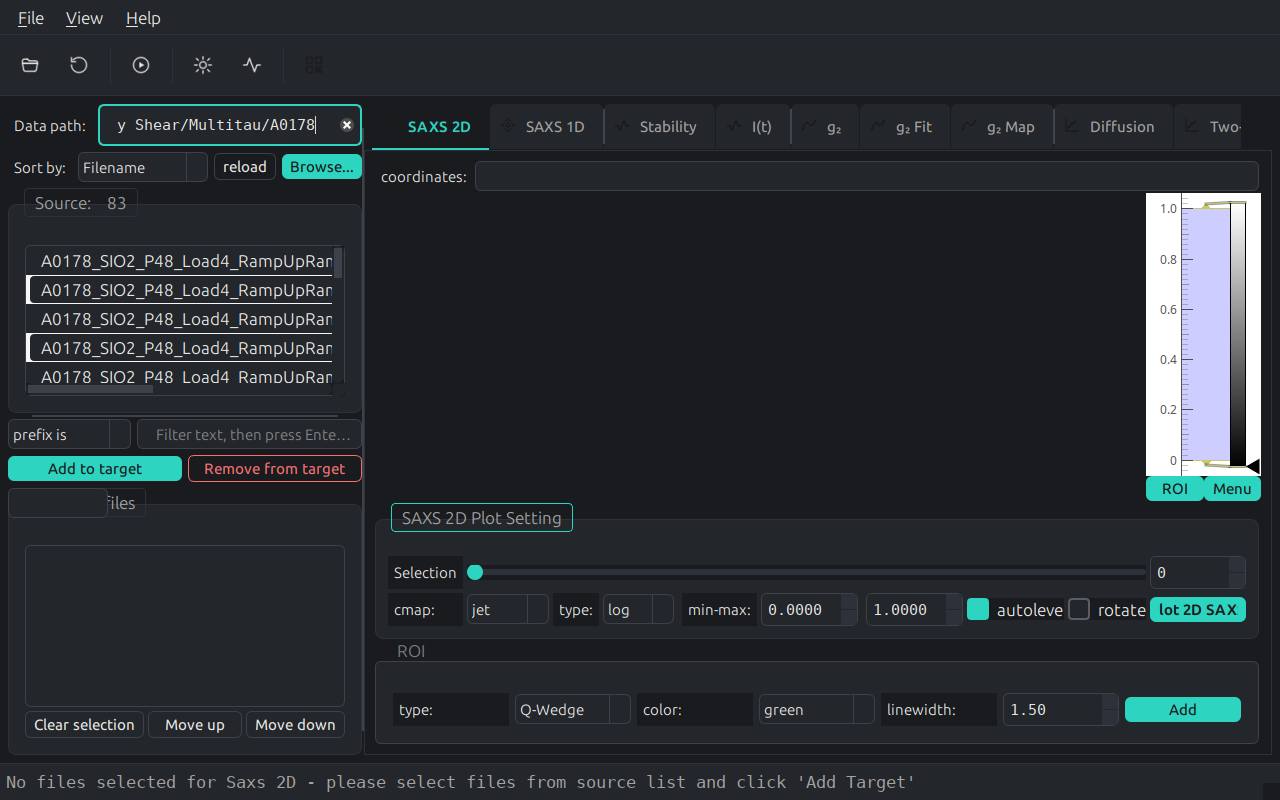
SAXS 2D – Integrated Scattering Pattern
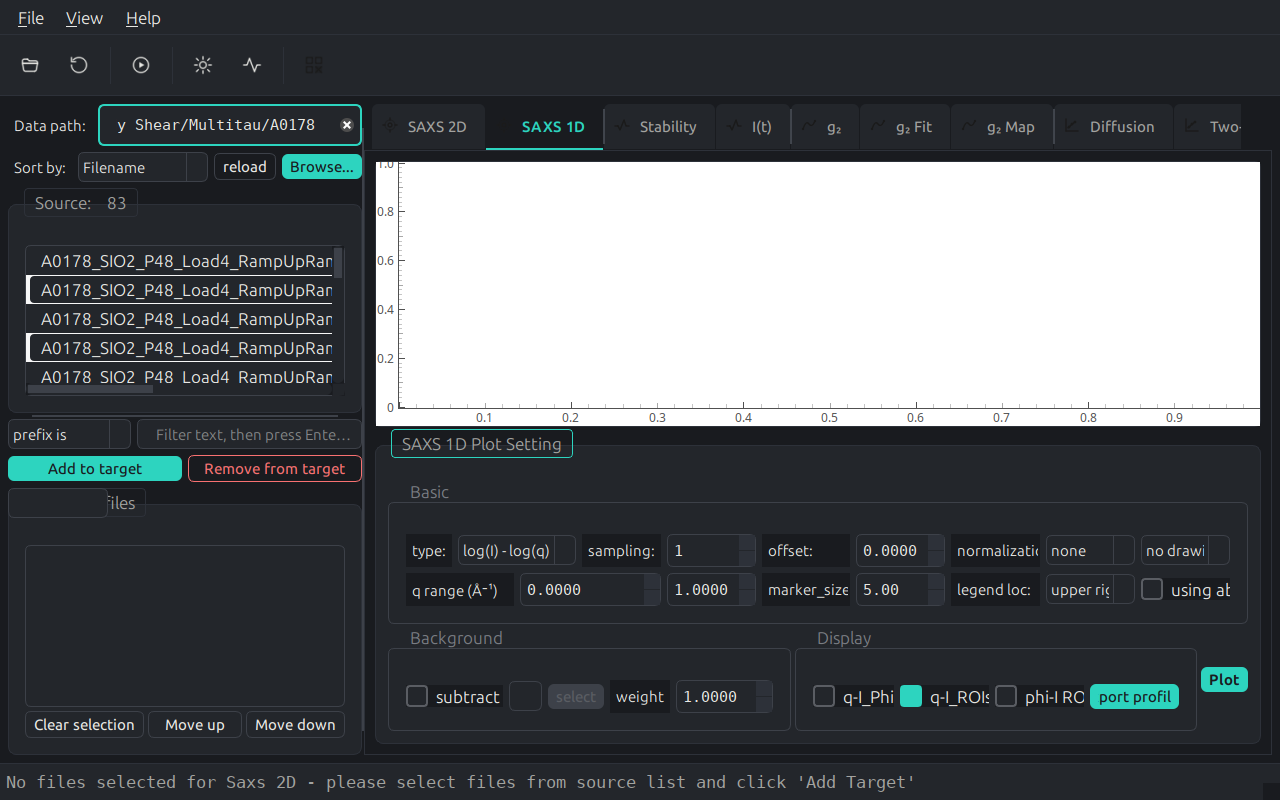
SAXS 1D – Radial Reduction and Analysis
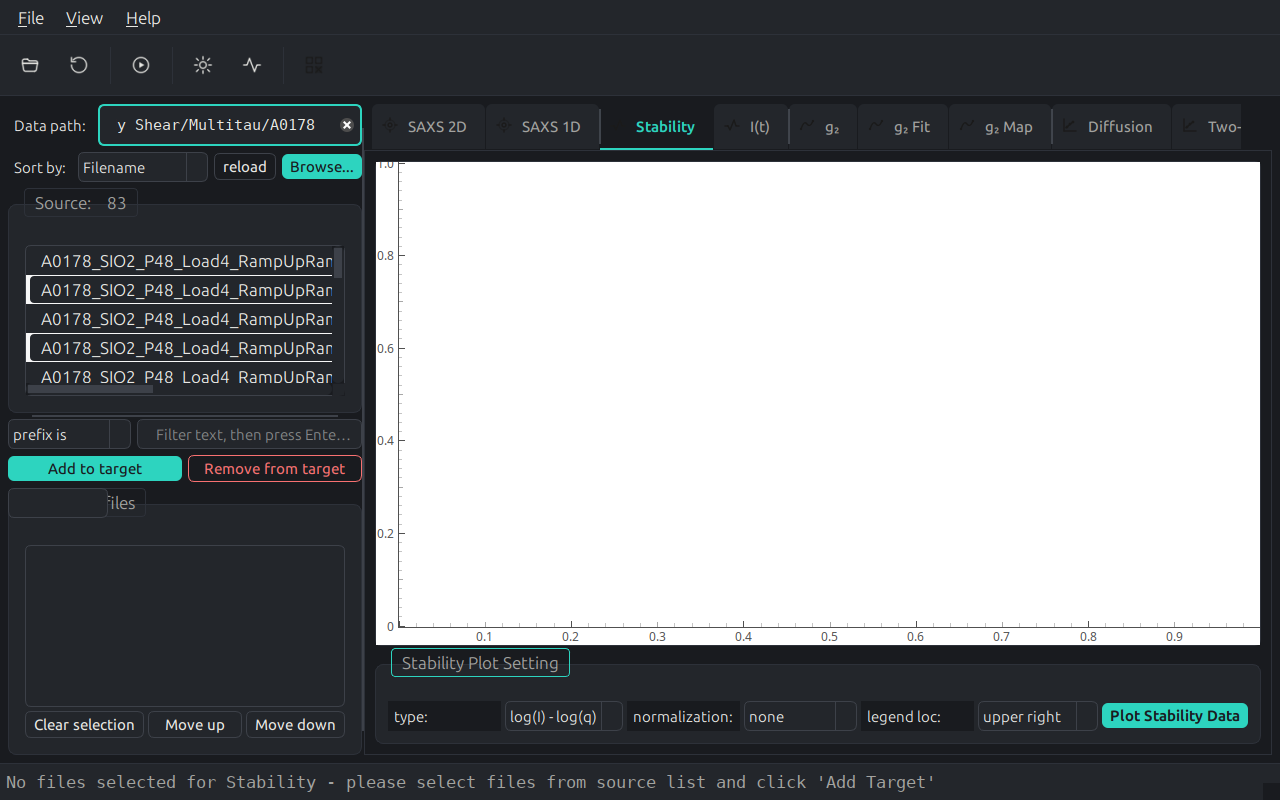
Stability – Sample Stability Assessment
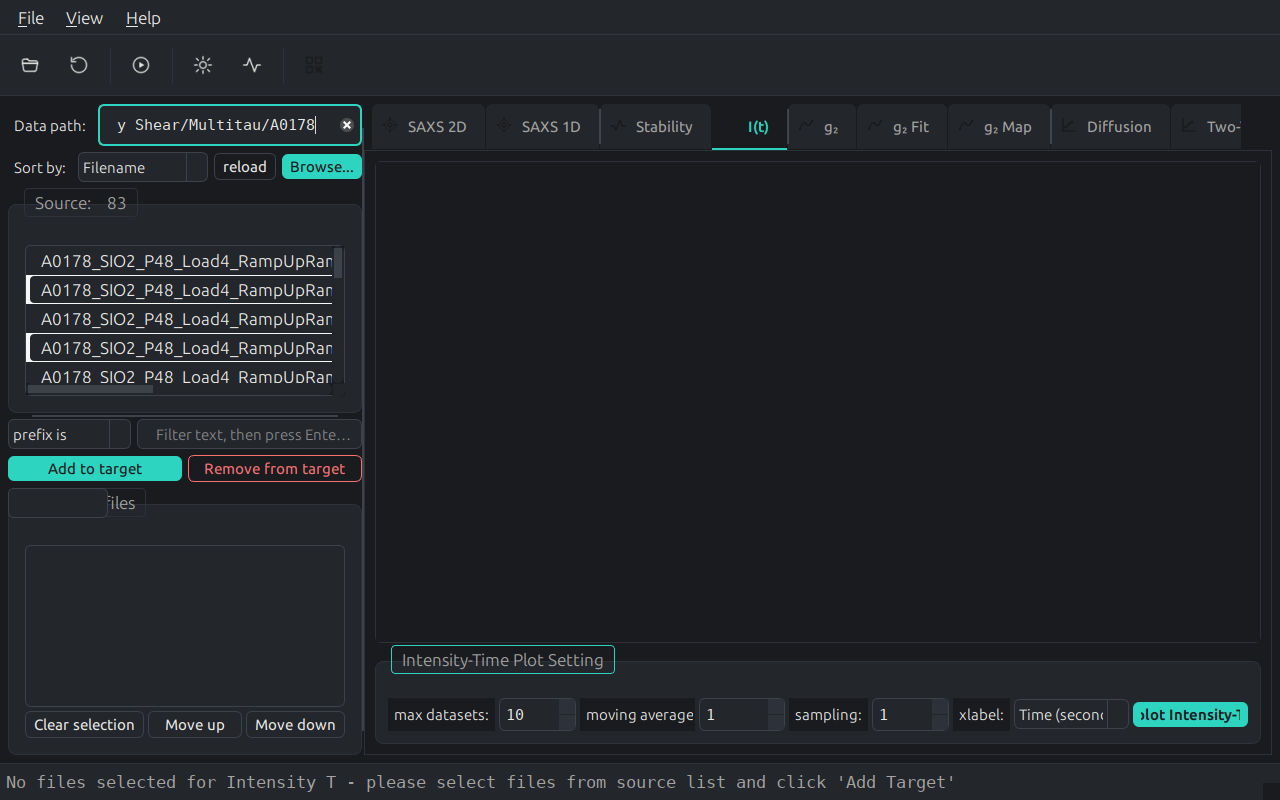
I(t) – Intensity vs Time Series
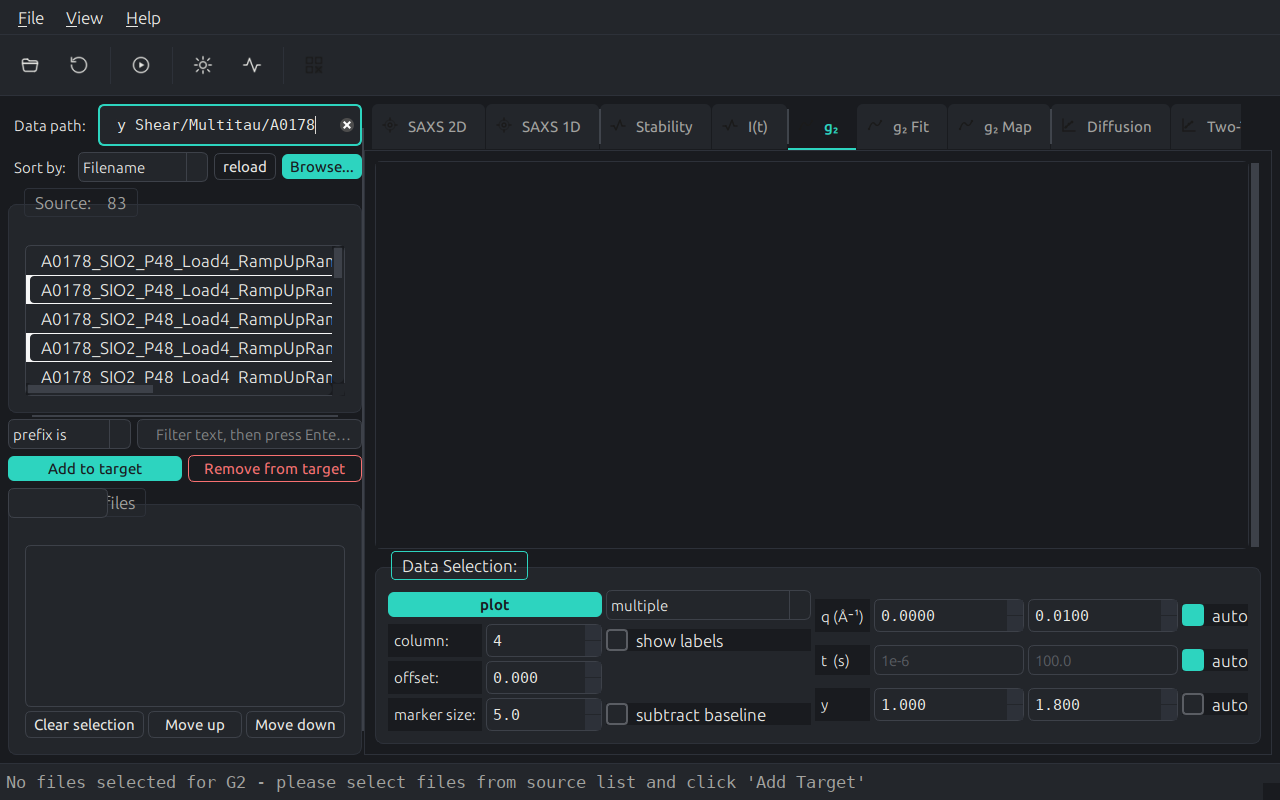
g2 – Correlation Function Viewer
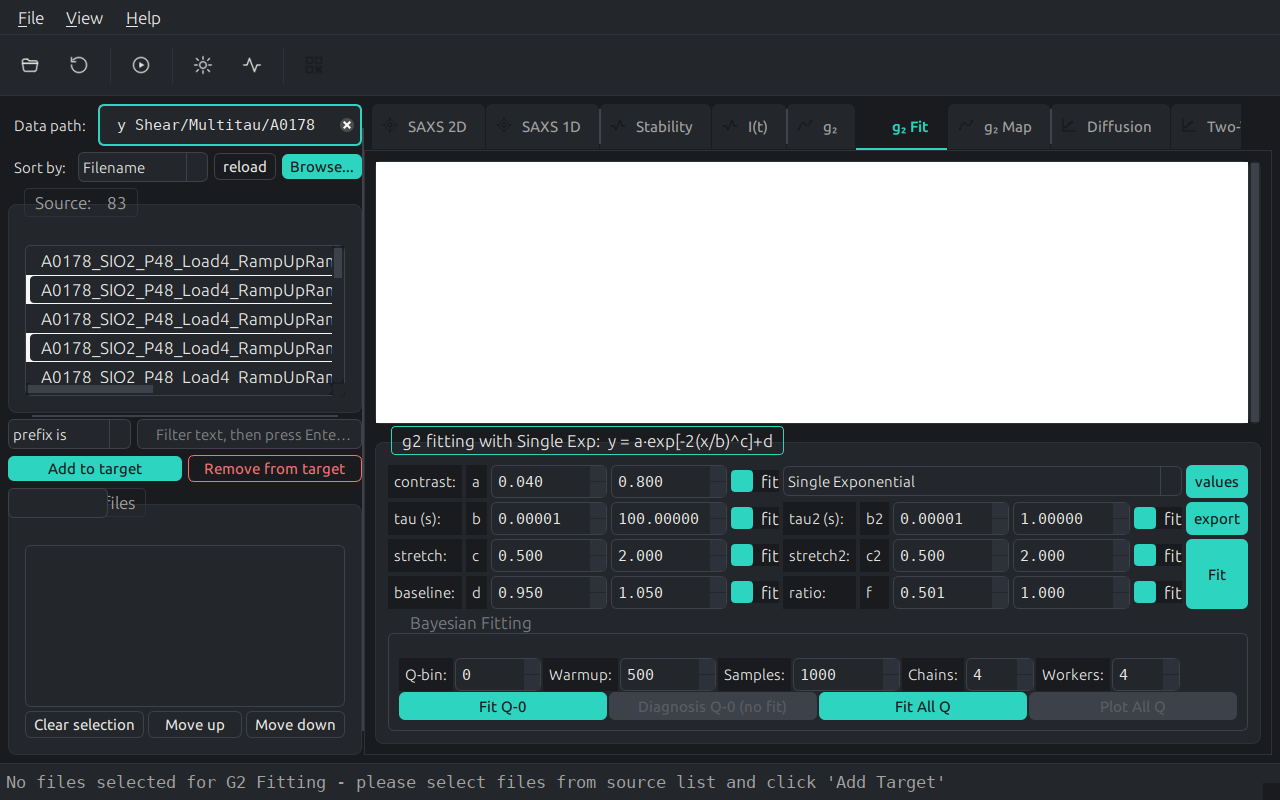
g2 Fit – Correlation Fitting
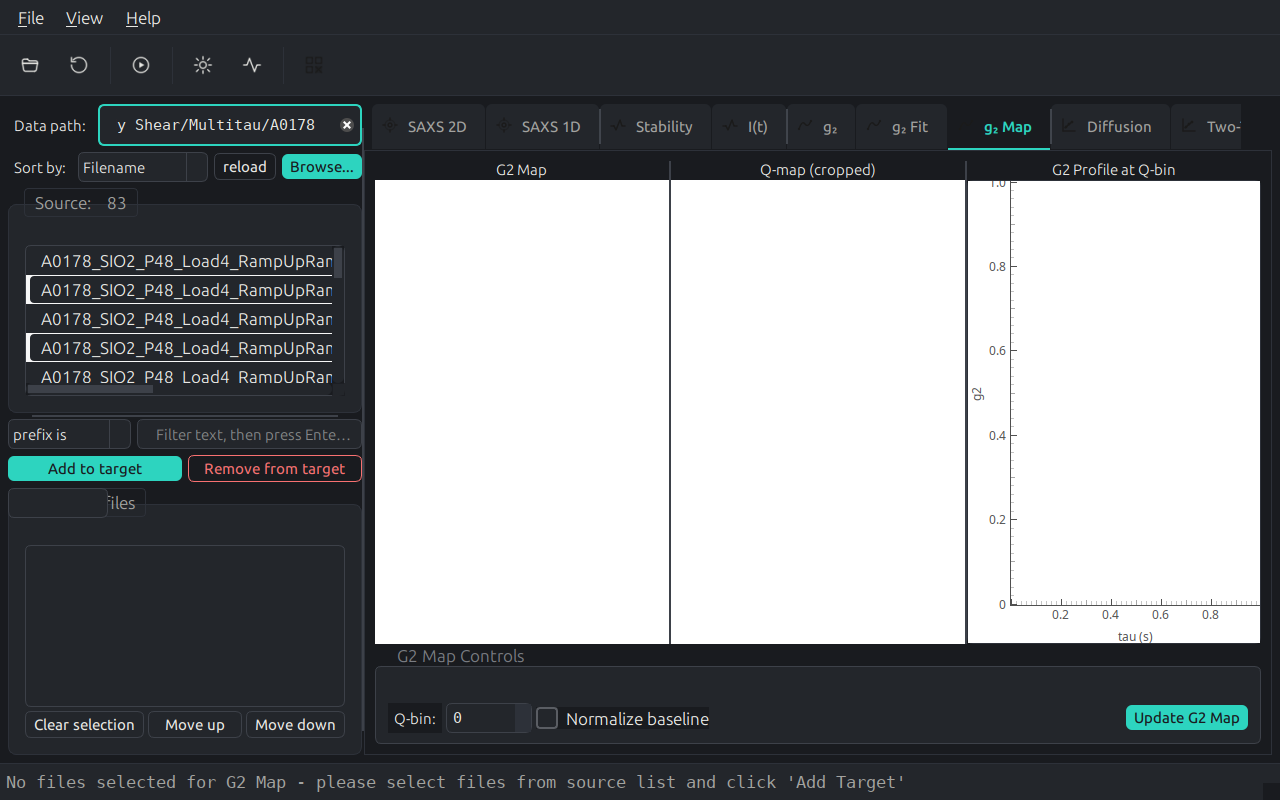
g2 Map – Correlation Map
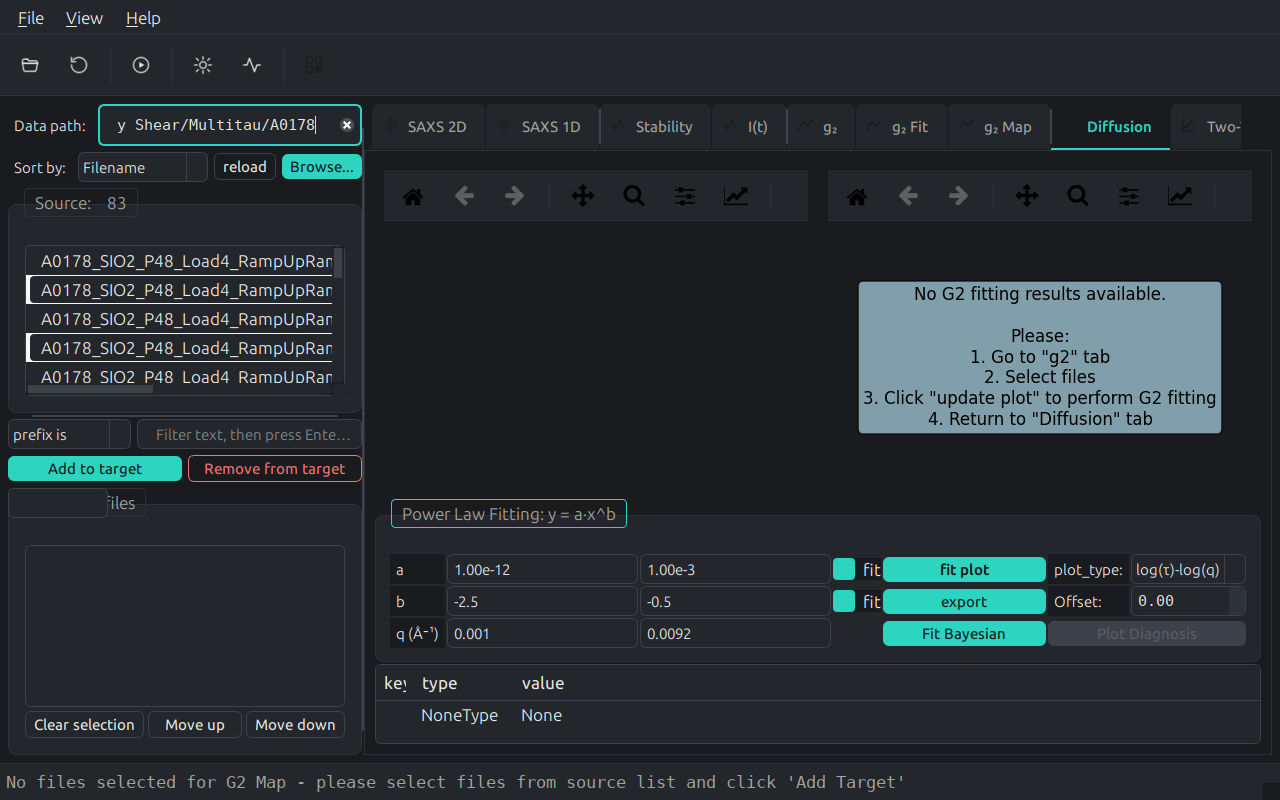
Diffusion – tau(q) Characterization
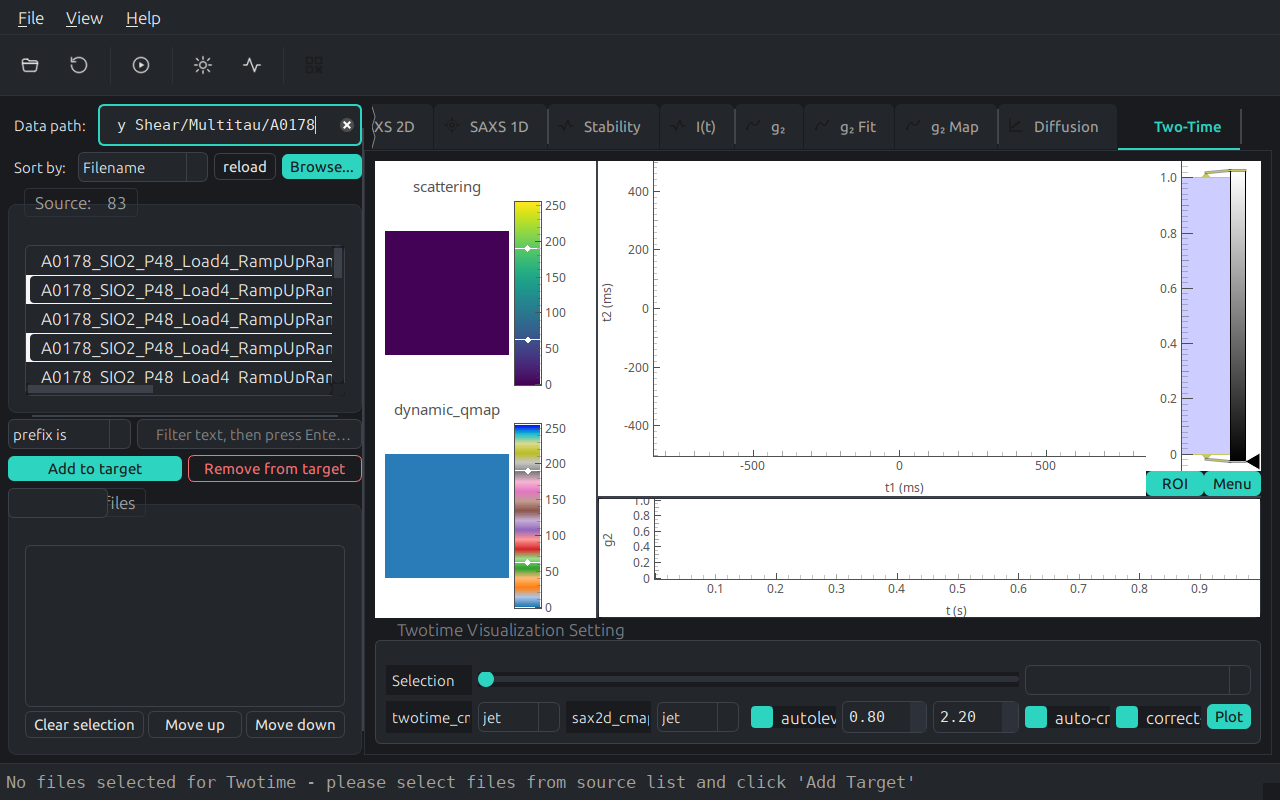
Two-Time – Correlation Maps
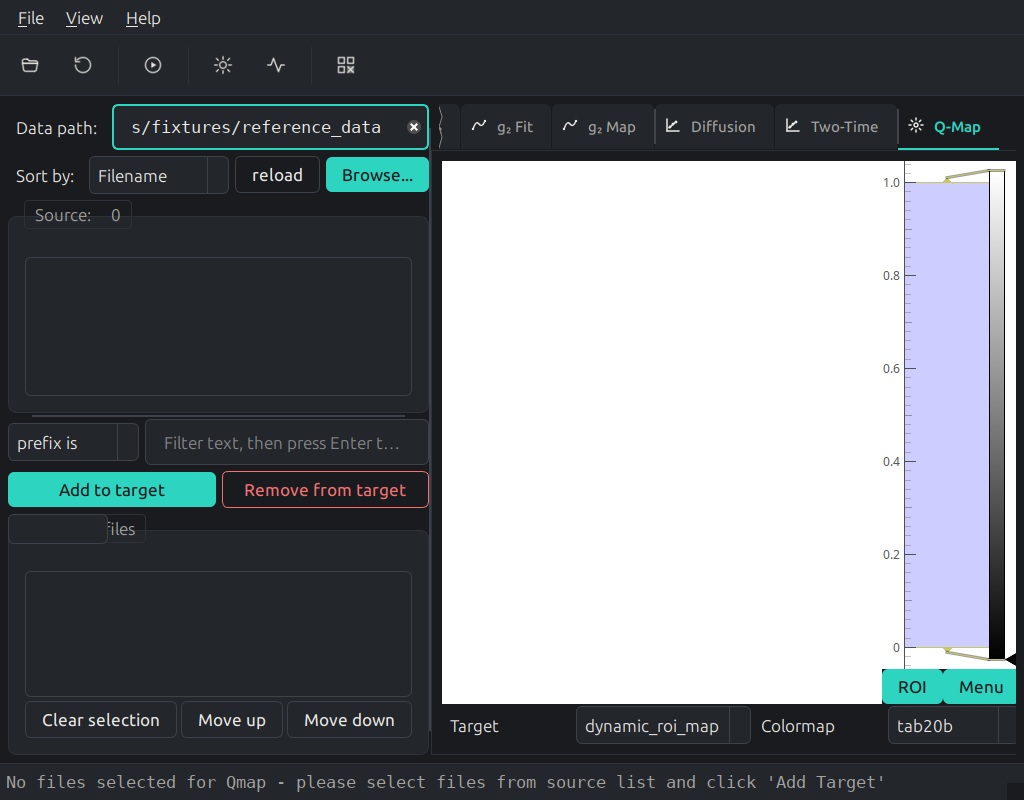
Q-Map – Q-Space Mapping
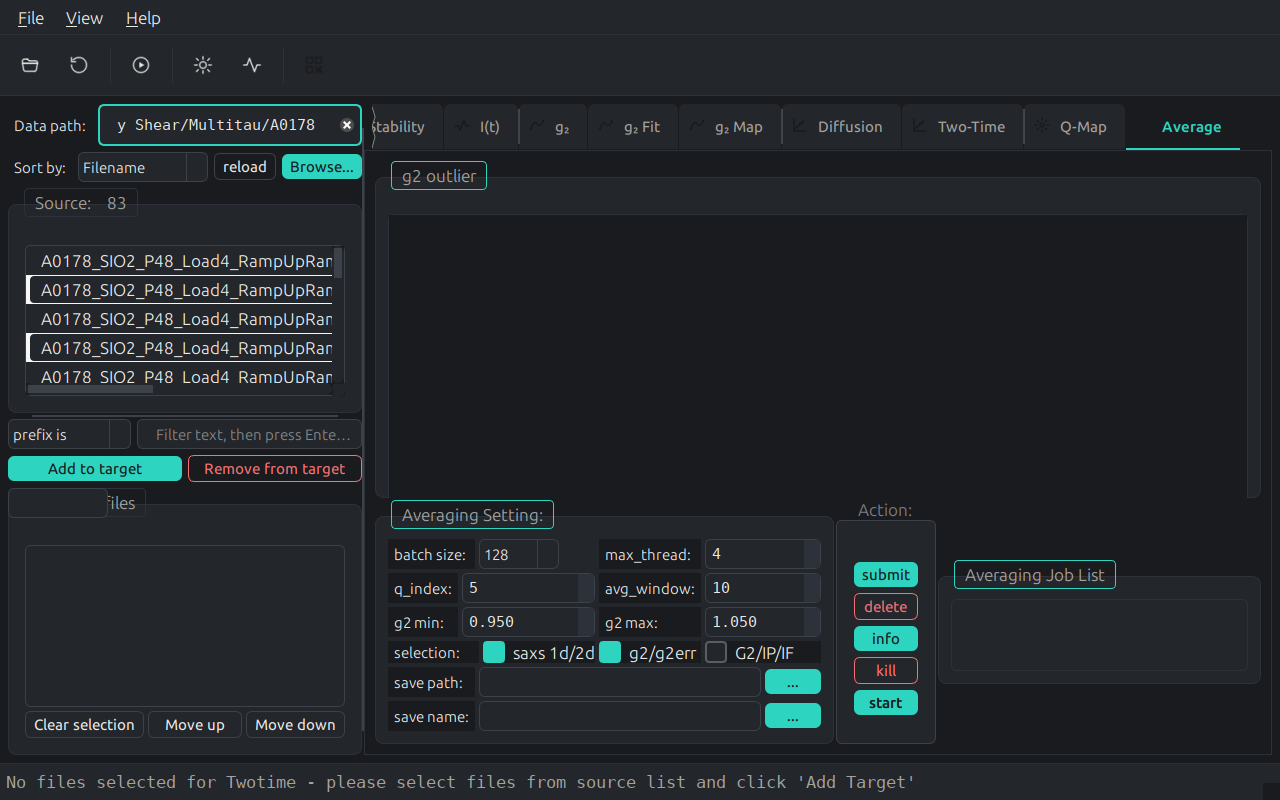
Average – File Averaging Toolbox
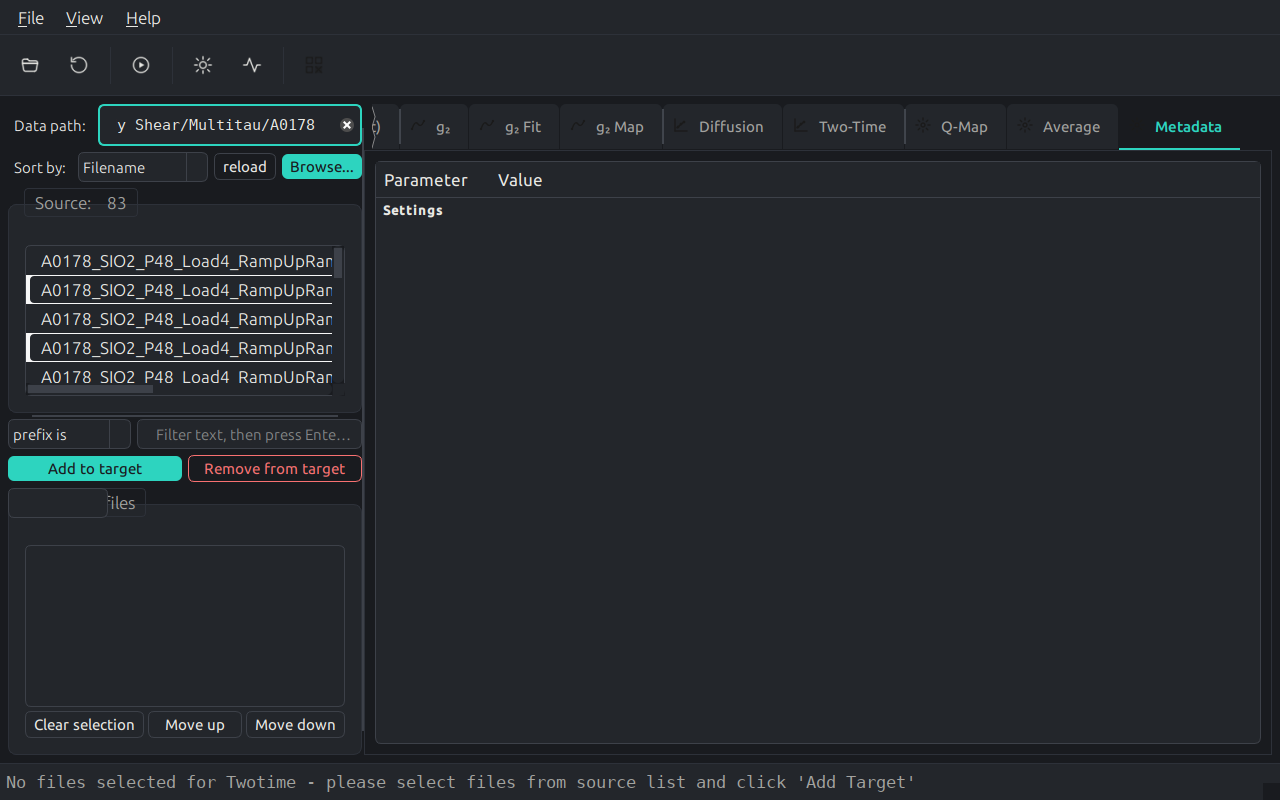
Metadata – HDF5 Explorer